
Profit ranking by procedure in facial harmonization

Quick facts
- Topic
- Ranking procedures by real margin
- Data needed
- Revenue, supplies, time, waste and selling costs
- Main metric
- Profit per chair hour
- Notice
- The ranking is your clinic's, not the market's
When a clinic owner says "lip filler is what makes us the most money," they are often talking about revenue, not profit. The best-selling procedure can be the one that leaves the least in the till after subtracting supplies, time, card terminal fees, product waste and touch-ups. Without a profit ranking, the clinic pushes the schedule toward what sells most and not toward what sustains the business.
This page teaches you to build the ranking with your own numbers. It does not provide a ready-made ranking, because the result depends on your price, your team and your market, and any list copied from another clinic would mislead you. The goal is management: understanding where profit comes from. The indication for each procedure remains the decision of the qualified professional, after assessment, and should never be driven by margin alone.
What goes into the profit of a procedure
The profit of an appointment is revenue minus everything it cost. For the ranking, use the contribution margin, which counts only the costs that vary with the appointment:
| Item | What to consider |
|---|---|
| Revenue | Amount actually charged, after discount |
| Supplies | Product used, plus the vial waste |
| Disposables | Syringe, needle, cannula, gauze, antiseptic, gloves |
| Selling costs | Card terminal fee, tax on the invoice, commission |
| Time | Chair minutes, from assessment to record keeping |
| Included follow-up | Review or touch-up at no charge, when it exists |
The difference between revenue and variable costs is the contribution margin. It is not the final profit, because rent, salaries and fixed costs still have to be paid. But it is the basis for comparing procedures with one another. See fixed and variable costs and profit margin in facial harmonization.
Why profit per hour is worth more than profit per appointment
Two procedures can leave the same amount in the till while occupying the chair for very different lengths of time. The chair, the room and the professional's hour are the scarcest resource in the clinic. That is why the measure that sorts best is profit per chair hour: contribution margin divided by the hours spent.
Using the hour as a yardstick also exposes opportunity cost: an hour taken by a low-return procedure is an hour that was not used for another. See the page on revenue per clinical hour and the clinical hour value calculator.
Step by step to build the ranking
The minimum price per procedure calculator and the average ticket per procedure calculator supply parts of this calculation. For disposable costs, see cost of disposable materials per patient.
How to read the ranking without being misled
The ranking is a map, not an order. A few readings help:
- Entry procedure. A lower-margin procedure can be the door through which the patient arrives and later takes on a larger plan. Cutting it can reduce overall flow.
- Anchor procedure. The one with the highest margin per hour usually sustains profitability, but it depends on demand. Margin without demand does not pay the bills.
- Procedure with follow-ups. If maintenance brings the patient back, their value over time goes beyond the single appointment. The patient LTV calculator helps you see that.
- Procedure that consumes touch-ups. If touch-ups are frequent and included, the real margin is lower than it looks.
- High-risk procedure. The cost of preparation and insurance weighs in, and the ranking should not push you to treat more than the team can safely handle.
A spreadsheet template for the ranking
Build a simple table. Fill in one row per procedure, with your data.
| Procedure | Appointments in the period | Average revenue | Supplies + disposables | Selling costs | Margin | Hours | Profit per hour |
|---|---|---|---|---|---|---|---|
| Procedure A | (your data) | (your data) | (your data) | (your data) | revenue minus costs | (your data) | margin ÷ hours |
| Procedure B | (your data) | (your data) | (your data) | (your data) | revenue minus costs | (your data) | margin ÷ hours |
| Procedure C | (your data) | (your data) | (your data) | (your data) | revenue minus costs | (your data) | margin ÷ hours |
Sort by the last column and notice two things: which procedures sit at the top and which, even though they sell a lot, end up at the bottom. The latter are candidates for an adjustment in price, time or touch-up policy. See pricing per ml and pricing follow-up and maintenance.
What to do with the result
Once sorted, the decision is not to cut the last one, but to ask why:
- Low price? Raise it. See the annual price increase.
- Time too long? Review the preparation and record-keeping routine.
- High waste? Review fractioning and stock. See product loss and waste.
- Excessive discounting? Review the discount policy.
- Too many touch-ups included? Set a rule. See whether to charge for touch-ups.
- Little demand at the top? Work on appropriate indication and ethical communication, without promising results.
The role of the complete plan
Part of a clinic's profit comes from the complete plan, not from the isolated procedure. When the patient understands the planned whole, they tend to book more than one area, which raises the ticket and spreads the assessment time across procedures. The page on how to increase plan acceptance covers this, and the ticket increase simulator for a complete plan shows the effect with your own numbers.
Harmy helps with presenting the plan: you mark the areas, enter the ml, generate the projection and show the before and after. The PDF quote uses the price per ml from My clinic. If your ranking shows that an area needs a price adjustment, update the saved value.
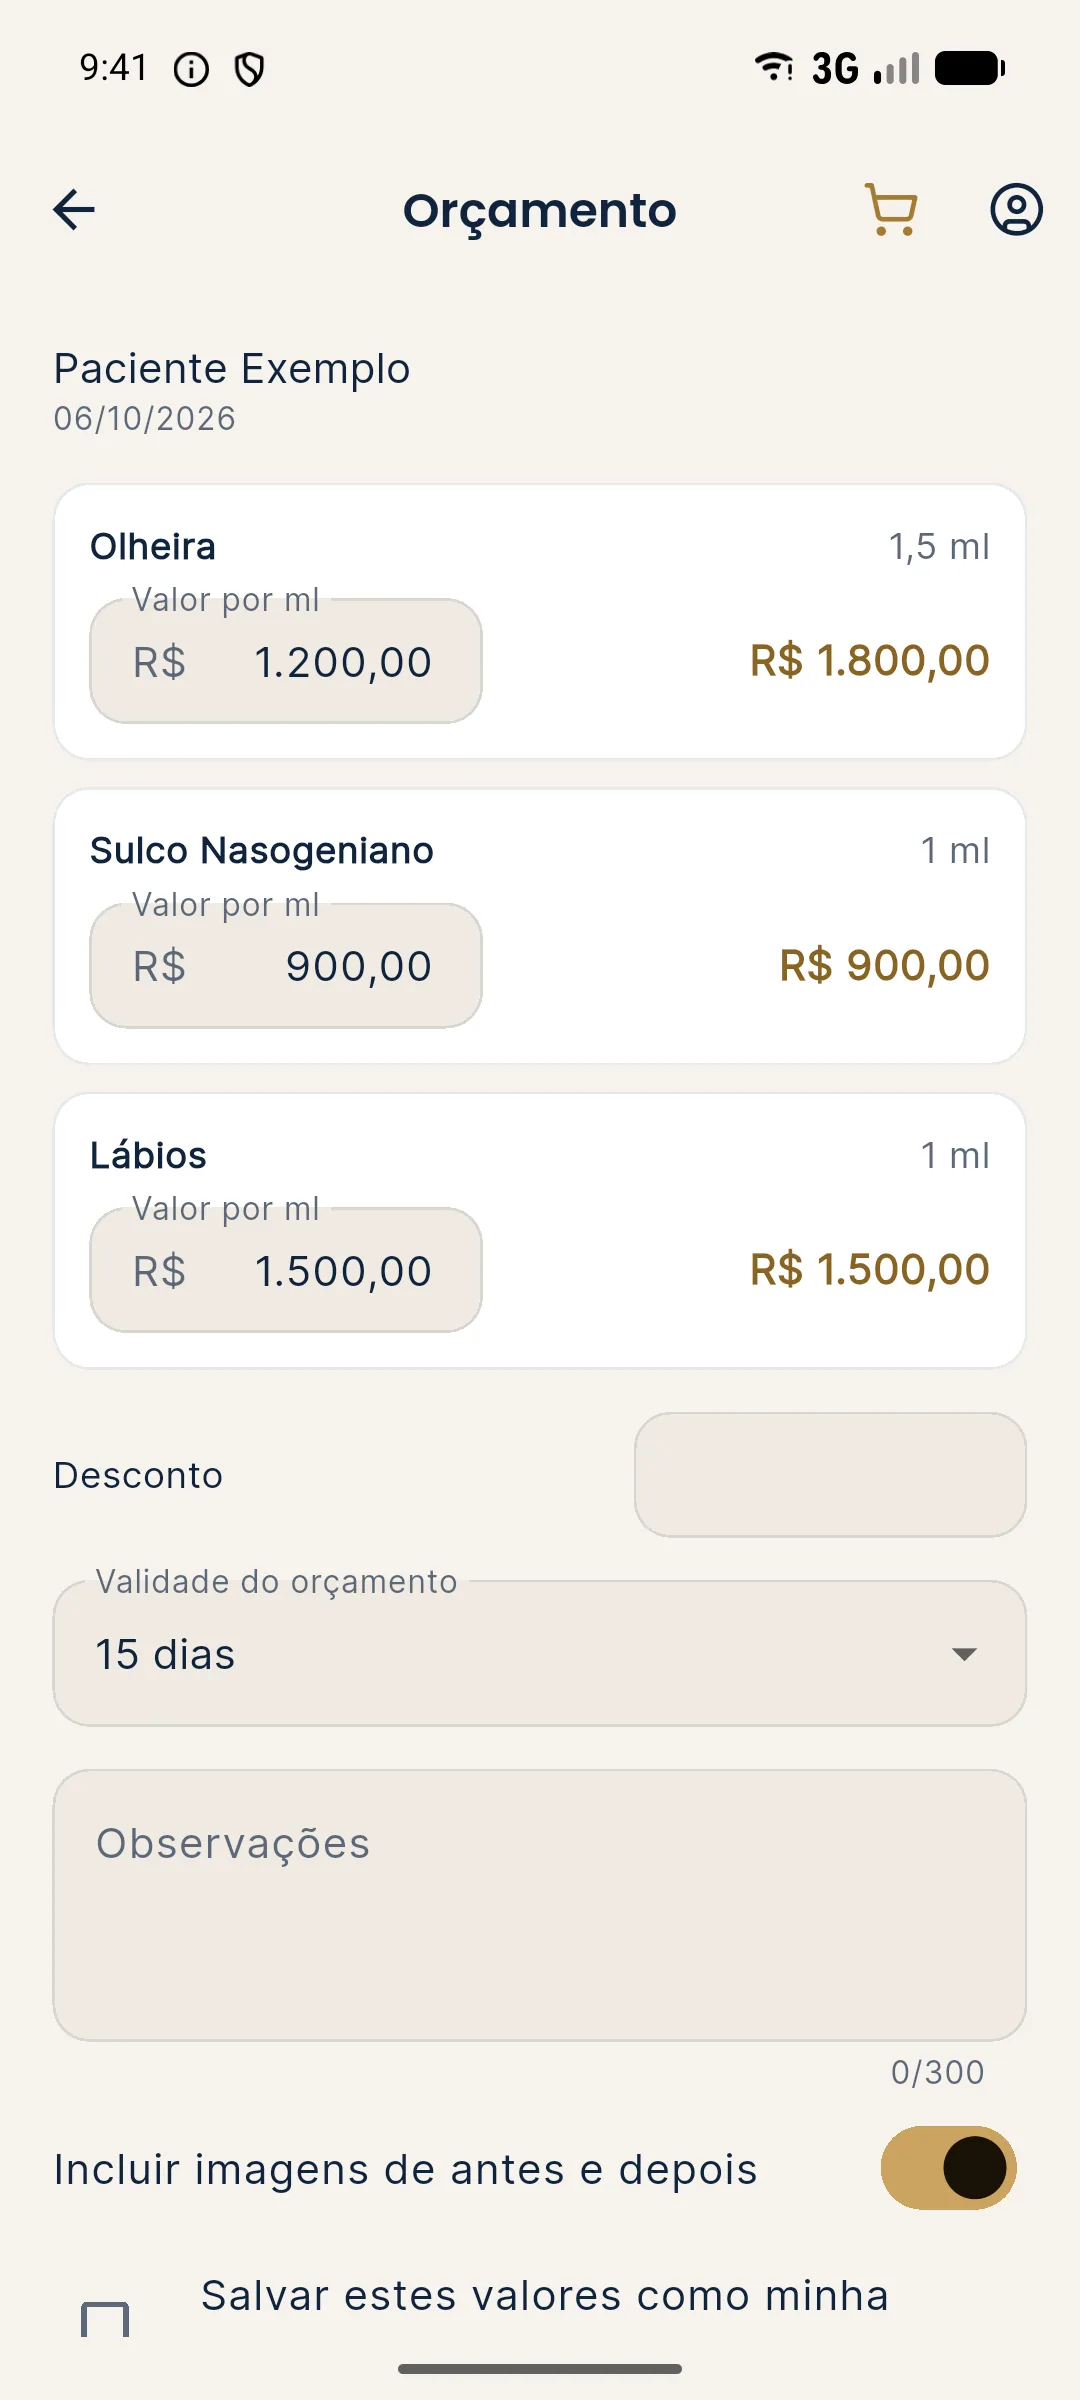
An honest ranking, redone twice a year, is one of the cheapest tools a clinic has for deciding where to invest time, training and communication. The number does not answer everything, but it makes the right question appear.
Frequently asked questions
Which procedure is the most profitable in facial harmonization?
There is no single answer. It depends on your price, supply cost, appointment time, waste and your clinic's demand. A ranking is only worth anything if it is built with your own numbers.
Should I offer only the highest-margin procedures?
Not necessarily. Clinical indication comes first, and lower-margin procedures can attract patients, bring them back and be part of complete plans. The ranking guides management, not indication.
Is it better to look at margin in dollars or in percentage?
Look at both, but prioritize profit per chair hour. A high percentage margin on a long procedure can earn less per hour than a smaller margin on a quick one.
How often should the ranking be redone?
Every six months, or whenever there is a relevant change in cost, price or average time. Data changes faster than you might think.